Unsecured data in the cloud – a risk to company
2 December 2019
BERT – new Google algorithm update
17 December 2019
The potential of mathematics in sports was shown a few years ago in the movie “Moneyball”, which was based on a true story of a baseball team using mathematical tools to improve sports performance. Elite athletes around the world are increasingly relying on sophisticated mathematical data to evaluate and improve personal performance and the performance of essential sports equipment. From the analysis of human movements to the body’s response to exercise, a thorough understanding of the mathematical techniques used is essential. Sports data analysis also affects team tactics. More and more trainers use statistics and conclusions from data analysis. The biggest sports teams even base their results on these analyses.
Data science in sport
The sports industry generates nearly $100 billion in annual revenues and is full of all sorts of statistics – winning probabilities, points total, exact score, player data performance, and more. Sports analytics deals with building predictive models based on a range of data. Sport Science, on the other hand, combines statistical analysis with programming knowledge. The first team to use data science in the history of professional sports was the MLB baseball team, the Oakland Athletics, on which the movie Moneyball was based. This team was the league’s newcomer, and won many games with many underestimated players in its composition. This is largely due to advanced data analysis.
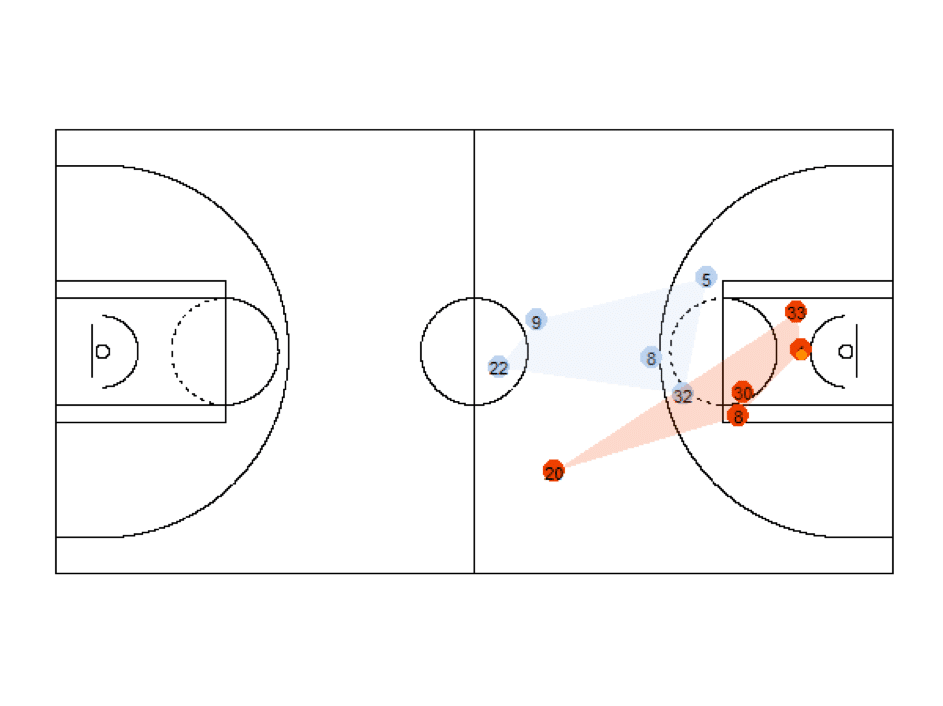
The American basketball league, the NBA, has annual revenues of approximately $5 billion. The contracts of the best players already reach almost $ 50 million a year, and these are their earnings only from the players’ salary (the best ones get the same or more from endorsement contracts). The stakes are really high in this league. As of 2013, most NBA teams have data analysts on their team. They work with coaches and players to maximize the talents of the players. They use data collected from each match or training session. Each sports hall of an NBA team has cameras that record games, and then analysts can extract the locations of players on the pitch from these cameras. Thanks to this, they can find out how effectively players pass or throw after previous plays. One of the teams in this league – the Houston Rockets – based its tactics to a large extent on the conclusions of data analysis. They make only two types of throws that are the most profitable according to analysts (these are three-point shots or from under the basket). However, data analysis can also have negative effects on players. If their statistics are not very good, they can count on the fact that this will be used when negotiating a new contract.
What is Sports Science?
Sport science Science is a relatively new thing, gaining popularity every year and more and more fans. It is an interdisciplinary subject that uses such fields such as:
- physiology and biomechanics, to measure what happens in the athlete’s body;
- psychology to analyze the role of the mind in performance;
- nutrition to help athletes properly power your bodies;
- business and sports management to understand the financial and operational sides of the sports industry
Sports science is a combination of several different disciplines that they focus primarily on the scientific basis of exercise performance. Main her goal is to understand the relationship between exercise and the human body, from from the cellular level to the effect on the body as a whole. Most graduates sports science is in the competitive sports industry because the competition for new achievements in various sports disciplines continues to intensify.
What technology use?
In the world’s largest leagues, data science is based on:
- SQL databases
- R and Python programming languages
- data visualization tools, i.e. Shiny or Tableau
However, one of the more interesting things is creating and adapting technologies to collect and visualize data. The NBA has 6 cameras installed in each arena to track the movements of players and referees at 25 frames per second, all in order to gain as much analytical data for teams and the league itself. With this technology, games can be tracked and analyzed for coaching staff to adjust defensive and offensive strategy based on the team or all-star they will be playing against. The data gives the team an advantage in adapting play and effort to the health of the opposing team and the individual player. This technology helps determine where a player is making their best throws. From next year, similar technologies will be used by one of the largest football leagues, i.e. the Italian Serie A, which has a contract with Math and Sports – a producer of special software for data analysis called Football Virtual Coach. Each coaching staff will have a special tablet giving them meticulous analytical support during matches. This allows you to provide trainers with a stream of exclusive information, constantly updated. In this way, the league wants to improve the quality of the show and increase the success of its teams.
Predictive analytics in sport
Predictive analytics can provide information on what lineup should come out in the next match. Allows you to estimate which player increases the team’s probability of winning. Machine Learning models are used for this. The model will be built using the player’s stats as a base and variables such as stats in the last match against that opponent, and form in home or away matches.
This is how it is done:
- Player Analysis – We can improve each player’s performance on the pitch and their fitness level by analyzing their training regimen and diet chart, then refreshing the analysis results.
- Team analysis – Using team statistics, we can build state-of-the-art machine learning models such as deep neural networks, SVMs, etc. to help team management calculate winning combinations with their probabilities.
- Fan management analysis – By knowing the factors that attract fans the most, team management can focus on improving this aspect, which leads to gaining a new fan base and retaining the old ones.
Advanced data visualization
Data visualization is a key tool in today’s data-centric world, and sport is no exception. Using raw data in tabular format, the coaching staff cannot gain clear insights and it will take a long time to go through all the data and capture the conclusions. Thus, presenting data in a graphical format allows management to visually see the analytics presented with charts and graphs, so they can capture difficult concepts or identify new insights. The next step to graphical representation is interactive visualization. Technologies such as Tableau, Qlikview or Rshiny are used for this.
The world of sports gambling
Sports analytics not only has a huge impact on sports events, but has contributed to the development of the sports gambling industry, which accounts for approximately 13% of the global gambling industry. Valued between $700 billion and $1,000 billion, sports gambling is hugely popular with a variety of groups, from avid sports fans to recreational gamblers, you’d be hard-pressed to find a professional sporting event where nothing would affect the results. Many gamblers are drawn to sports gambling because of the abundance of information and analysis at their disposal when making decisions.
How Data Science is changing sport?
Is it Olympic Games or all kinds of World or European Championships, after The Champions League and the American leagues NBA, NFL, MLB are sports spectacles attract billions of people. Sport is full of confusing and uncontrollable variables such as weather, unique physiology of individual players, referee decisions and choices made by players during a game or match. That due to the continuous advancement of technology in the field of Big Data analysis, acquisition sports data is relatively easy. This is where data analytics and data science come in and reveal predictive insights for optimal decision making across the industry sports.
Analytics helps you measure other elements during a sporting event such as ticket purchases, fan engagement, fan interaction, and more importantly, fan retention rates. The return of fans to the stadium is a key element, and analytical methods are becoming the main trend to measure these prospects. This helps to make it a reality through the application and innovation of technology and the adaptation and combination of both of these trends in the sports industry. In the next 10 years, the sports industry will certainly be different and more advanced from an analytical point of view. It is unknown how players, coaches and fans will react to different methods, approaches and analyses. So far, methods, trends, analytics, and other innovations are improving the viewing experience and giving athletes better results.


